Greetings. April proved to be a busy (good busy) month. I apologize for the delay in this post.
I delivered my presentation “Publish and Prosper: Tips on Promoting Student Generated Knowledge in the Public Sphere” on March 27th during the inaugural School Leadership Summit. The mission of the conference was “to kick off an event that would perpetuate and would be a place for broader conversation amongst school leaders and the ed tech / blogger / social media crowd.” Stay on the lookout for future online conferences.
This post expands upon my conference presentation. A special thanks to my session moderator Jason Borgen, program director at the Santa Cruz County Office of Education. Check out these links.
- The Summit recordings are all archived here
- My presentation is here
So… on to this week’s post.
_____________________________________________________________________________________________________________
Infographic: An umbrella term for illustrations and charts that instruct people, which otherwise would be difficult or impossible with only text. Infographics are used worldwide in every discipline from road maps and street signs to the many technical drawings in this encyclopedia.” -PC Magazine
A picture may be worth a thousand words, but a collaboratively generated, student infographic is priceless. Infographics, at their best, are research based student products synthesizing text, design and visuals– typically specialized maps, charts, themes, graphs, and illustrations – in one creative and specially designed media. At their worst, infographics are glorified collages or posters. What distinguishe(and elevates) an infographic beyond these static items is technology’s impact on design, crowd sourcing, and the abiltiy to edit and update information. What’s more, their educational appeal has grown with the advent of “media literacy” and “information literacy” as 21st century skills related to college and career readiness and the adoption of the Common Core State Standards.
- They convey a lot of information using specific language selection.
- Useable with low language levels.
- Visual and mathematical / statistical aspects can help to convey meaning.
- They are much easier to read then dense text on a computer screen.
- They lend themselves to be used across disciplines.
- You can find infographics quickly and easily on almost any topic.
- They develop multiple literacies and intelligences in students.
- You can help students to become more critical of information sources.
I am arguing that infographics should be promoted as student generated media/knowledge that add to existing discussions, can be effectively shared and modified, help achieve the demands of 21st century education, and promotes a culture of connectivism (see below). When combined, these represent the culture of a “Networked Classroom.”
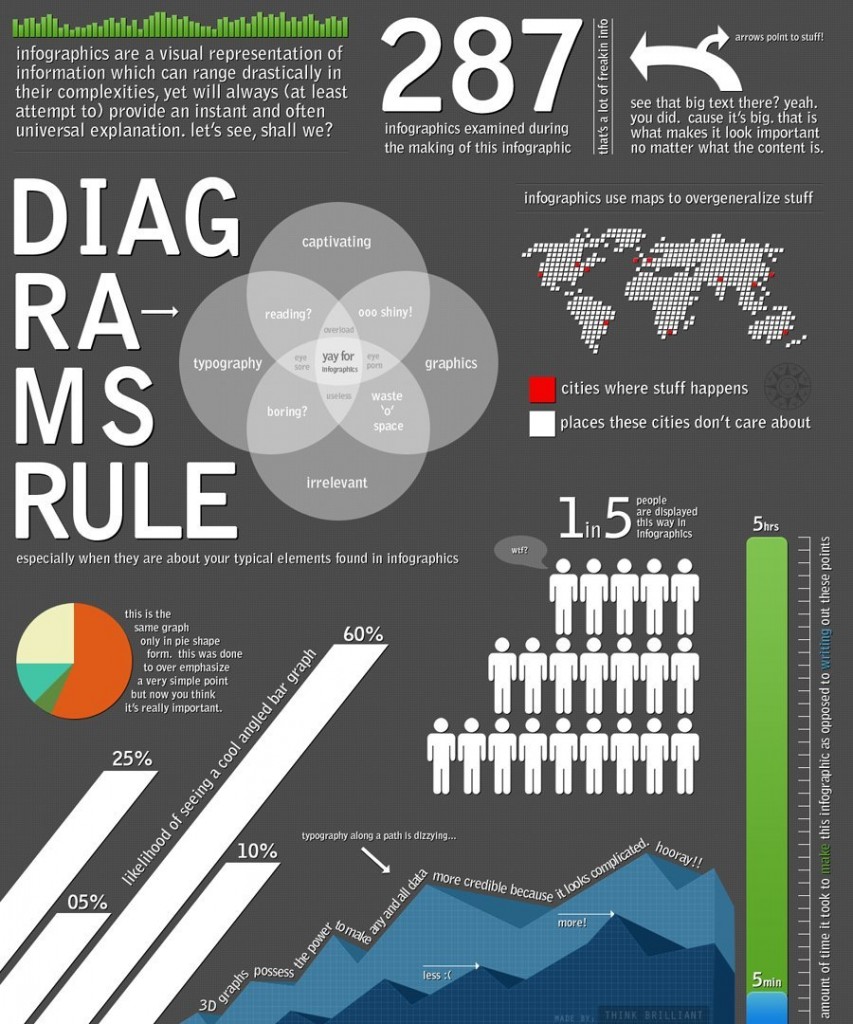
Two Infographics about infographics
1) From EVR: Informed Ingenuity
Infographic Resources: Deciding which inforgraphic tool to use in your classroom is based (in my experience) on personal preference and school approval around privacy issues (do students have to register) and technology specs. There are advantages to having students in a district use multiple, common (2-3) formats. Here is a selection of infographic tools inspierd by the Daily Tekk’s 100 list.
- Visual.ly: Visually is a one-stop shop for the creation of data visualizations and infographics
- Infogr.am: Create infographics in just a few minutes. No design skills needed.
- Easel.ly: Create and share visual ideas online.
- Piktochart: Our Mission is to simplify information and make it exciting
- Tagxedo: Turns words — famous speeches, news articles, slogans and themes, even your love letters — into a visually stunning word cloud.
- iCharts: Create great-looking charts in minutes with interactive and easy-to-share data.
These are a great start. But if you want to see some dynamic samples on infographics done professionally, as well as links to more information on infographics, try these:
- NY Times: Focus on social studies and history infographics
- Daily Infographic Every day we feature the best information design and data visualization from the internet.
- Cool Infographic: highlights some of the best examples of data visualizations and infographics found in magazines, newspapers and on the Internet.
-
Information is Beautiful… see the TED video below. This collection is incredible!
- Infographic a day: What is new is that infographics’ volume, frequency, and the richness of the media.
What is Meant by the Public Sphere in Education?
The networked classroom encourages a culture of investigation, knowledge creation, connectivism, trust, and personalized learning. Teachers utilize their Personal Learning Network (PLN) and students can identify and tap into their own Student Learning Networks (SLN). Notice in the video below the comment that “His teacher rarely lectures. “I recognize there is use for lecture and that there are degrees of lecture substance and purpose. However, it is clear that the style argued against is the “drill and kill” teacher centered, sage-on-stage style which some teachers erroneously claim will be the only style used in higher education.
Once your students are collaborating with peers beyond your classroom, teachers can empower their 21stcentury classroom by placing student work in
the public sphere.What is meant by the “public sphere.” Simply put, the public sphere is anything beyond the teacher’s eyes only. The idea of students writing a paper for a teacher’s eyes only is an anachronism. Placing student in the public sphere is easy to do with social media. One suggestion is to do this in a secure course in your school’s LMS. Moreover, students accept greater responsibility and are more invested in their work. Consider the list below a continuum moving from “narrow” to “broad” public spheres. Next to each dimension are a few suggested ways student work can interact beyond teacher-eyes-only models.
a) …classroom: gallery walks, class discussion of student work.
b) …department: peer editing from other sections, presenting to other classes, discipline website highlighting student work
c) …school: display tables at lunch, displays in hallways, newspapers, library archives, part of parent nights
d) … community: student work in civic buildings, displays, local newspapers,
e) … nation: engage in projects like National History Day, collaborate with schools, and colleges, engage in contests
f) … international: establish sister schools, link with non-profits, video conferencing
g)… cyber space: present at online conferences, post work on websites, establish a learnist board, comment on blogs, utilize web 2.0 tools.
Who is calling for students to generate knowledge and publish it for public consumption? In NEW DIRECTIONS IN SOCIAL EDUCATION RESEARCH: The Influence of Technology and Globalization on the Lives of Students it is argued that “As pressures mount for society to equip today’s youth with both the global and digital understandings necessary to confront the challenges of the 21st century, a more thorough analysis must be undertaken to examine the role of technology on student learning (Peters, 2009).” Likewise, “youth are active participants, producers, and distributors of new media. The digital production of youth includes over 38% of designing personal websites, 23% constructing online videos and slideshows, and 8%launching digital causes campaigns….The internet has allowed youth new opportunities in fostering global awareness of civic, humanitarian, political, economic, and environmental causes (Maguth p.3).
The arrow chart (above) frames the public sphere in spatial terms. An0ther model (below) emphasizes the level of student engagement and teacher management. The best approach to teaching and learning will draw from both spatial dimensions and personal interaction.
Student work in the public sphere can manifest in a variety of forms. Overall, this is a very exciting part of contemporary education that should be part of any collaborative classroom in the 21st century. The infographic is part of this educational model.
Rubrics:
The popularity of Infographics have spurred a variety of rubrics for teachers to utilize. My favorite are here:
- Kathy Schrock’s detailed 9×3 matrix
- Townsend Memorial Library
- The Self-Proclaimed Rubric Roadmap for Infographics
If you find one that you think is just as good or better, let me know.
Synthesis – Connectivism and Media Literacy
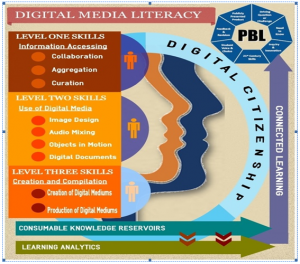
At least two epistemologies drive networked classrooms to use infographics as the format for student generated knowledge to be shared in the public sphere. These two ideas, Connectivism and Media Literacy,join with other learning theories (constructivism, behaviorism) and competencies (college, career, civic etc.) in the world if contemporary teaching and learning. Both are described below.
Live long. Publish and Prosper.
According to professor George Siemens, “connectivism is driven by the understanding that decisions are based on rapidly altering foundations. New information is continually being acquired and the ability to draw distinctions between important and unimportant information is vital. Also critical is the ability to recognize when new information alters the landscape based on decisions made yesterday” (Siemens, 2005).
Center for Media Literacy: Media Literacy is a 21st century approach to education. It provides a framework to access, analyze, evaluate, create and participate with messages (information) in a variety of forms — from print to video to the Internet. Media literacy builds an understanding of the role of media in society as well as essential skills of inquiry and self-expression necessary for citizens of a democracy.


Craig,
Terrific resources and information. Thanks so much for that.
Really enjoyed it. Thanks!